Establishing the extent and patterns of women’s participation in architecture is a complicated, convoluted business. Gill Matthewson and Kirsty Volz have been working hard to generate more reliable data. In the first of three posts, Gill updates the numbers, starting with the state of play in Australia’s architecture schools.

Photo: Nick Bassett
The first place to start when mapping women’s participation in the profession is to look at how many women are actually entering architecture. These days most enter the profession from an accredited architecture school program.
There are 18 architecture schools in Australia. In 2011 there were 9222 students in total studying architecture across the two degrees in Australia.1
- Women made up 42% of these students.
- Women made up 44% of the intake into year one of the first degree.
Coming in and going out
Last century (particularly in the 1970s and 1980s) there was a considerable attrition of women from the schools.2 That is, the proportion of women entering the schools was much higher than the graduation rate. Architecture had a reasonably high attrition rate for all students, but it seemed to affect women much more than men. That attrition imbalance has; however, shifted markedly and has increasingly improved over the years for which we have data.
The chart below overlays the proportions of women in first year intakes, in total numbers of architecture students, and in graduates over the last two decades. Of note is the way that these numbers start to coincide over the last five years (notwithstanding the aberration in intakes for 2002 and 2004). This indicates that proportion of women studying architecture is stabilising – there is no longer a marked attrition of women prior to completing the degree. This is especially noticeable compared to the situation in during the 80s and 90s.3

Proportion of women at different levels in all schools of architecture, 1987–2010
It should be noted that individual schools have quite different attrition patterns to the country-wide pattern, but taken overall the trend is of equitable attrition.

Teaching staff
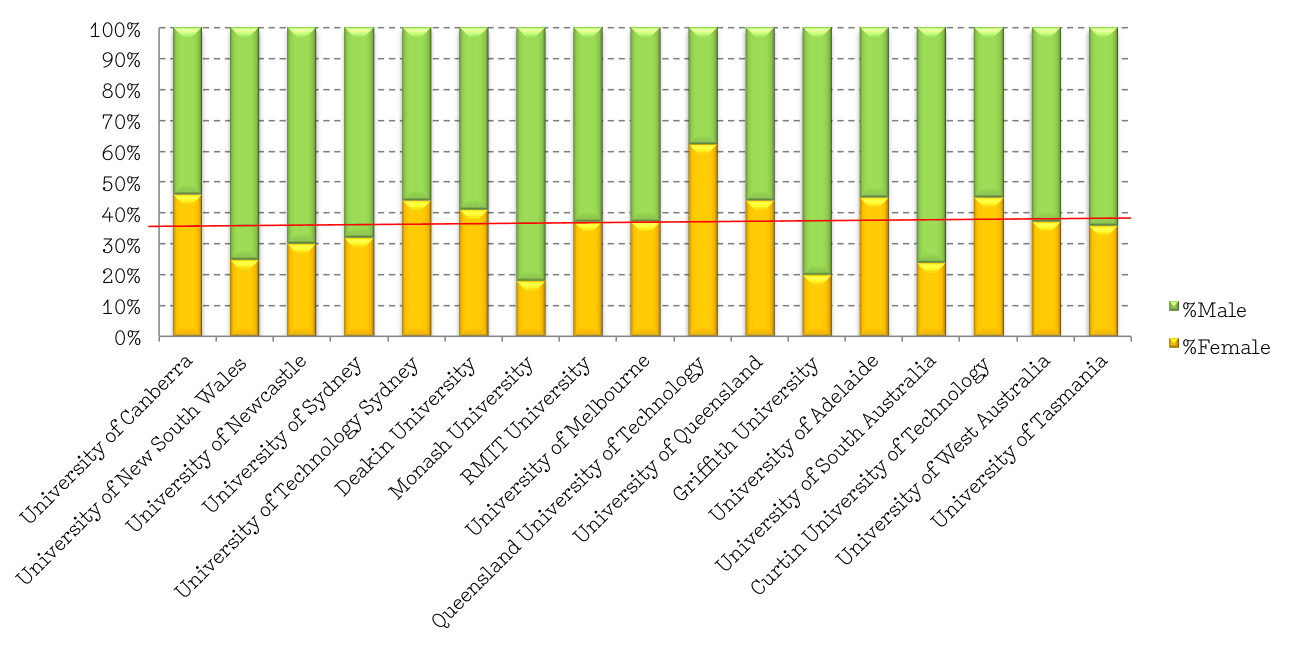
Individual schools vary considerably in the gender balance of their teaching staff – from 18% to 62% female. Overall, women make up 37% of the teaching and research staff.4 (Sessional staff have not been included in these statistics as their numbers vary considerably from school to school and semester to semester.)
Female teaching staff in architecture schools by state

As seen in the chart below, women are concentrated in the lower levels of teaching staff.
Where schools have research-only positions (five out of the 18 schools) these positions are dominated by women. Research-only position are often not full-time and also have more flexible hours; however, they are also not as secure as other positions.

After architecture school, female graduates enter the profession in similar proportions to those graduating, but their participation in the profession in the following years drops off over time. The next post outlines two ways of measuring women’s participation in the profession once they leave architecture school.
- Statistics in this section are extracted by Carol Capp, National Education Coordinator, from Australian Institute of Architects, ‘Architecture Schools of Australasia’ 2000 to 2011 editions, November 2011. This is supplemented by data from the 2012 edition and 1987 to 1999 editions, also supplied by the institute. Note: data pre-2000 is less reliable than post-2000 as reporting protocols differed between schools pre-2000. We have tried to crosscheck this data by requesting information from the graduate offices of individual universities. We have not received enough data to make a more definitive chart, but the general trend of a rise and a levelling off has been confirmed.[↩]
- It is difficult to obtain data to confirm this for Australia, but it has been well-documented for other English speaking countries. See Gill Matthewson ‘Take it to the Limit: Women and the Architectural Profession,’ in Harriet Edquist & Hélène Frichot (eds) Limits, Melbourne, Australia: Society of Architectural Historians, Australia & New Zealand, 2004, pp 319-325; and Errol John Haarhoff, Practice and Gender in Architecture: A Survey of New Zealand Architecture Graduates 1987–2008, Auckland: University of Auckland, 2010.[↩]
- This data is from the ASA books and is only as accurate as the information that schools provide to the ASA.[↩]
- Data obtained from the 2011 ASA book, and supplemented by school websites. This was collated and sent to the schools for confirmation. Four of the 18 schools are yet to confirm their data.[↩]


